Identify Where the Meter Receives Its Signal
A microphone signal passes through several stages before another person hears it. Hardware input gain, system input controls, browser capture, application processing, the mix and playback can each change a reading. Write down the microphone, application, meter type and measurement stage before comparing numbers. A meter before a fader cannot demonstrate the level after that fader. The same spoken phrase can produce different readings in a browser test and a recording application because the source selection or processing differs. Keep the chain unchanged for a useful comparison instead of treating one number as the microphone's permanent level.
Read Full Scale as a Digital Reference
dBFS expresses a digital level relative to a full-scale reference. For a normalized sample-amplitude reference of one, amplitude 0.5 is approximately −6.0206 dBFS and 0.1 is −20 dBFS. Zero dBFS is a reference level, not silence. Zero amplitude has no finite logarithmic level; a meter may show silence or minus infinity. Room noise can remain present during a pause, so quiet speech is not the same as all-zero samples. Digital numbers do not supply a calibrated sound-pressure reading. No conversion from these values alone can identify the sound level at a person's position.
Distinguish Sample Peaks, RMS and Loudness
A sample peak is the largest absolute sample in a measured window. RMS squares the samples, averages those squares and takes the square root. Four samples of 0.1, −0.1, 0.1 and −0.1 have RMS 0.1 and peak 0.1. Samples of 0.2, 0, 0 and 0 have the same RMS but peak 0.2. Their RMS level is −20 dBFS in both cases, while their peak levels differ by about 6.02 dB. The table is independent arithmetic, not a recorded voice. RMS is also not a LUFS measurement or a complete estimate of perceived loudness.
Use the Browser Microphone Result for Its Actual Task
Savvy Toolkit's microphone test displays RMS amplitude and RMS dBFS from 2,048 time-domain samples. It refreshes the visible reading at most each 100 ms. That cadence does not measure the microphone's sample rate or physical latency. Speak a repeatable phrase and compare it with a quiet pause while keeping position and selected input fixed. The test shows arriving digital signal and does not provide a sample-peak meter, waveform, recording or clipping diagnosis. Do not copy its RMS dBFS value into the manual gain calculator's observed peak field. Two equal RMS readings can require different peak-based adjustments.
Obtain a Peak Reading from the Intended Recording Chain
Use a meter explicitly labelled sample-peak dBFS in the application where the adjustment matters. Note whether it measures input, a track after processing or the final output. Reset its peak hold when available and run a representative passage, including the stronger words expected in the actual task. Document microphone position, input selection and active processing. A brief whisper cannot establish the maximum for a later loud passage. A held peak records the selected interval, not every future performance. Software with only an average or loudness reading does not provide the observed sample peak this calculation needs.
Choose a Target with the Task's Requirements in View
The calculator accepts a stated observed peak and chosen target, both finite dBFS values at or below zero. It does not prescribe a target for a podcast, game chat or music recording. Delivery specifications and the application's output meter define the relevant goal. A target of −12 dBFS leaves a modeled 12 dB below the reference for the measured peak. That margin is not a prediction of stronger future peaks. A target of zero leaves no modeled margin. Avoid confusing a distribution loudness requirement with a peak target; they describe different properties and may require separate measurements.
Work Through the Gain Change Before Touching a Control
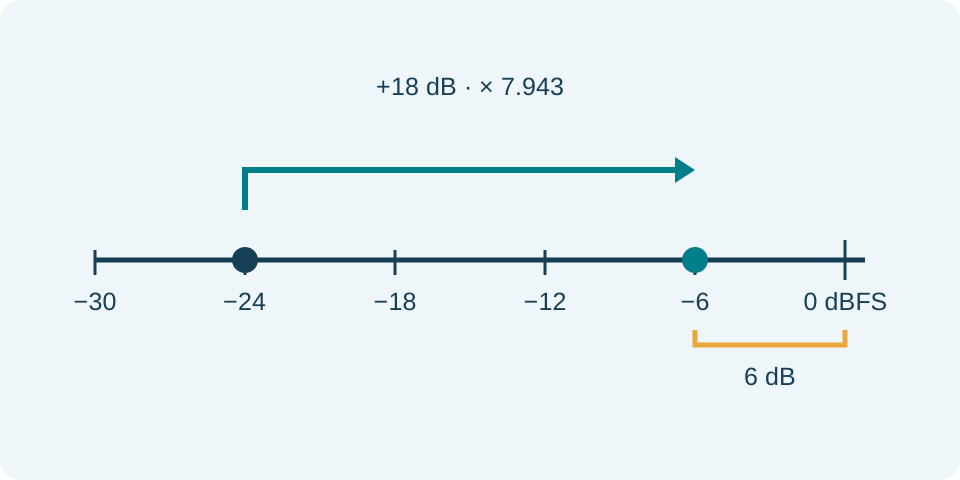
Subtract observed peak from target peak to obtain gain in dB. For −30 dBFS observed and −12 dBFS chosen, the difference is +18 dB. The amplitude multiplier is 10^(18/20), about 7.943282. For −3 observed and −9 chosen, the difference is −6 dB and the multiplier is approximately 0.501187. Equal observed and target peaks give zero dB and a multiplier of one. These examples show the calculation, not recommended recording settings. The tool reports gain, amplitude ratio, modeled target peak and target margin. It does not adjust hardware or translate that gain into a knob percentage.
| Observed dBFS | Target dBFS | Gain dB | Amplitude × | Margin dB |
|---|---|---|---|---|
| −30 | −12 | +18 | 7.943282 | 12 |
| −3 | −9 | −6 | 0.501187 | 9 |
| −12 | −12 | 0 | 1 | 12 |
| −6 | 0 | +6 | 1.995262 | 0 |
Keep Amplitude Ratios Separate from Power Ratios
An amplitude ratio uses 20 × log10(ratio). A factor of two therefore equals approximately +6.0206 dB, and a factor of one half equals −6.0206 dB. A +6 dB change is close to doubling but is not exactly two. Power ratios use a factor of ten in the logarithmic expression under the appropriate physical assumptions. Do not apply the power formula to these sample-amplitude inputs. The speaker test's 5% and 10% controls multiply sample amplitude by 0.05 and 0.1. Doubling those values says nothing certain about a listener's perception or the hardware's electrical output.
Understand Why Gain Also Raises Existing Noise
Fixed linear gain multiplies the whole existing signal, including noise already present at that point. A signal sample of 0.02 and a noise sample of 0.002 both doubled become 0.04 and 0.004; their amplitude ratio remains ten. This example does not model every noise source in a real recording chain, because later stages can add their own noise. Turning up a completed noisy recording cannot recover detail that was never captured. Compare microphone placement, source selection and the stage where noise enters before adding gain. A quieter pause in one application can also reflect processing rather than better hardware.
Allow for Automatic and Dynamic Processing
Automatic gain control changes gain over time. A compressor or limiter can apply different changes to quieter and stronger passages. Noise suppression can alter a pause and speech differently. A fixed multiplier cannot predict the complete result of those processes. Record which features are active in the intended application, then repeat the same passage at the same meter stage. This page's manual calculation does not model attack, release, thresholds or processing order. Reducing a fader after samples were damaged by clipping does not restore their original shapes. Correct the earlier stage when evidence identifies it, then make a fresh comparison.
Separate Internal Floating Samples from Final Output Limits
An internal floating-point audio path can contain values above the nominal amplitude reference. That does not prove that every internal stage has already clipped. A later constrained output, conversion or device can still require a suitable level. The calculation here deliberately accepts nonpositive sample-peak dBFS inputs; it is a bounded planning tool, not an inspection of an entire audio engine. Sample peaks also differ from true peaks estimated between samples in reconstruction. A sample-peak target alone cannot certify a true-peak delivery limit. Use the meter and processing required by the receiving specification rather than treating all references as interchangeable.
Verify an Adjustment with a Reversible Comparison
Keep a note of the original control value before changing it in the actual application or device. Apply one change, repeat the same passage at the same distance and compare the same meter stage. Include the stronger material again, then listen at a consistent playback setting. A changed system playback volume can make the recording seem louder without changing the recorded samples. The manual calculation is checked arithmetic; the next performance remains a new observation. Persistent distortion across controlled tests deserves checking the source and earlier stages, with the documented readings available for the application's or device's official support.
Keep Level, Channel Routing and Encoded Bitrate Separate
Gain changes sample amplitude. Speaker routing chooses where channels are sent. Streaming bitrate describes encoded data per second. Raising bitrate does not by itself set the microphone's level, and a louder output does not prove a better connection. Use the speaker test for a deliberate Left/Right playback observation, then test a short call or recording in its intended application. Savvy Toolkit's tests have no acoustic calibration, and this guide supplies no universal pass score. A useful record includes source, meter type, stage, representative passage, chosen target and observed result after the actual change. That record supports a concrete next check.