How to Use This Tool
- Enter a positive frequency in GHz and the antenna separation in metres.
- Read the loss in dB and compare the 2.4, 5 and 6 GHz references at the same distance.
- Compare the twice-distance result. Keep modelled attenuation separate from actual signal measurements.
Calculation Method
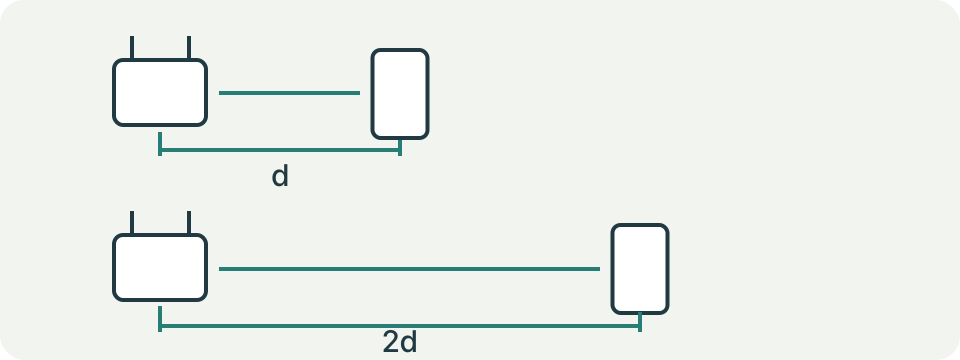
Free-space loss = 20 log10(distance in m) + 20 log10(frequency in GHz) + 32.4478 dB. The reference rows change frequency while keeping distance fixed. Doubling distance adds about 6.02 dB of loss within this model.
Worked Example
At 2.4 GHz over 10 m, loss is about 60.05 dB. At 20 m it is about 66.07 dB. At 5 GHz over the original 10 m, the model gives about 66.43 dB. These are attenuation values, not received signal power.
Choose a Reference Path, Not a Room Coverage Score
Enter the radio frequency in GHz and the straight-line separation between antennas in metres. The calculator returns an ideal attenuation reference in dB, a second result at twice the distance, and rows for 2.4, 5 and 6 GHz at the original distance. It does not read the router, discover nearby networks or inspect a floor plan. Use the result to understand the effect of frequency and separation before comparing actual observations. A larger loss means more attenuation within this model, not a measured weaker connection.
Read the Units Before Entering Values
The frequency field expects GHz, so 2400 MHz belongs here as 2.4 GHz. The distance field expects metres, so 10 feet is about 3.048 m rather than 10 m. Spanish, Portuguese and French editions accept their local decimal separator. Zero, negative and non-finite inputs cannot define this calculation. A very small positive distance can still produce a number even though the far-field assumptions are unsuitable. Numerical acceptance is not physical validation. Record antenna separation rather than walking distance around furniture.
Understand the Formula and Doubling Result
The implementation evaluates 20 log10(4πdf/c), with d in metres, f in hertz and c equal to 299,792,458 m/s. Its logarithmic form avoids multiplying very large inputs. With frequency entered in GHz, the equivalent constant is about 32.4478 dB. Doubling separation adds 20 log10(2), about 6.0206 dB, regardless of the original distance. This is a ratio expressed on a logarithmic scale. It is not six fewer signal bars, six percent less power or a six-megabit speed reduction.
Check an Independent Example
At 2.4 GHz and 8 m the reference loss is about 58.1138 dB. At 16 m it is about 64.1344 dB. Keeping the distance at 8 m and changing frequency to 5 GHz gives about 64.4890 dB; 6 GHz gives about 66.0726 dB. These comparisons alter one input at a time. The difference between the first two rows is about 6.02 dB, while the frequency comparison follows 20 log10 of the frequency ratio. Rounding the display does not change the calculation underneath it.
| Frequency (GHz) | Distance (m) | Loss (dB) |
|---|---|---|
| 2.4 | 8 | 58.1138 |
| 2.4 | 16 | 64.1344 |
| 5 | 8 | 64.4890 |
| 6 | 8 | 66.0726 |
Keep dB Separate from dBm
Loss in dB describes a power ratio. Received power in dBm describes a power level relative to one milliwatt. A router or diagnostic utility might report a negative dBm reading; it is not the same quantity as the positive loss shown here. Estimating received power would require a stated transmit level, antenna gains and other losses. Those controls are absent from this tool. Do not subtract its result from an unspecified transmitter number or relabel the result as RSSI. Signal quality and delivered throughput need separate observations.
Why Walls Cannot Be Added as a Fixed Correction
Real indoor paths include reflection, obstruction, antenna orientation, bodies and interference. Two positions at a similar distance can behave differently. A wall count alone does not describe material, thickness, angle, openings or surrounding paths. The calculator deliberately has no wall selector and does not return a floor-plan heatmap. The far-field requirement also depends on wavelength and antenna dimensions, so one universal minimum distance would be misleading. A successful arithmetic result does not certify coverage, suitable router placement or the maximum usable distance of a device.
Make a Controlled Real-World Comparison
Keep the same device, access point and activity. Record the band, position, time, orientation and the observation source before moving one item. Compare a direct open path with the practical location, then repeat rather than keeping only the best sample. A throughput test uses network and server capacity as well as the radio link, so keep it beside the observation rather than treating it as proof of path loss. Avoid changing channel, router power and location together. The record should show exactly which single change was tried.
Choose the Next Check from the Symptom
A connection that works nearby but fails behind an obstacle deserves a placement comparison. A connection that fails even nearby may require configuration or device checks before distance modelling. Slow file delivery can involve an application, storage, congestion or the remote service. Use the download-time calculator only after choosing a plausible measured transfer rate. No result here recommends a product, guarantees a faster band or identifies a defective antenna. Keep theoretical attenuation, observed signal and actual task performance in separate columns when discussing the problem with support.
What the Result Means
The formula assumes ideal free-space propagation in the antenna far field. Walls, reflections, interference, antenna orientation and receiver behaviour can change real results. Close-range validity depends on antenna dimensions and wavelength.
Common Questions
Is Loss in dB the Same as Signal Power in dBm?
No. dB expresses a ratio or change; dBm expresses power relative to 1 mW. This calculator reports attenuation in dB.
Can This Estimate Wi-Fi Speed Through a Wall?
No. A free-space reference excludes that wall and cannot determine throughput.